
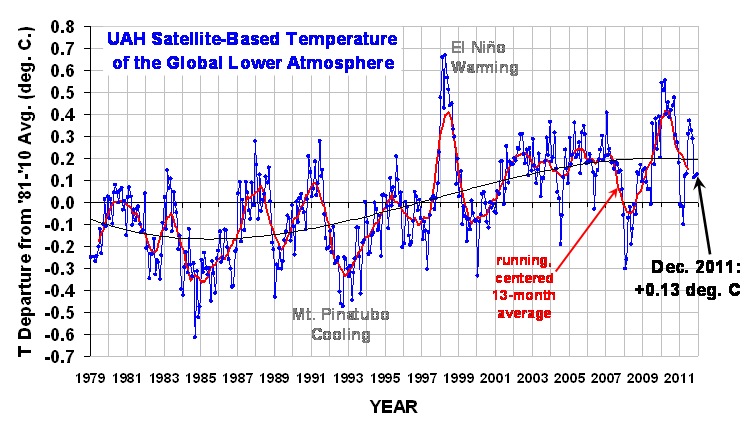
Graph by Dr Roy Spencer and Dr John Christy, University of Alabama, Huntsville.
http://www.drroyspencer.com/wp-content/uploads/UAH_LT_1979_thru_December_2011.png
NOTE: Click to enlarge, or see the full size graph at the bottom of the blog page.
It seems that global atmospheric temperatures are not the only way that global warming can be measured, as explained in this extract :-
"As a recent 'Skeptical Science' post by Dana Nuccitelli has pointed out global warming hasn't stopped, despite a recent lull in global surface temperatures. The oceans, which are the main heat sink for global warming, have scarcely skipped a beat in soaking up heat. The hiatus in global surface temperatures appears to simply be a reflection of natural variability, principally the exchange of heat between the ocean surface and the atmosphere. But we shouldn't expect this to last much longer. Eventually that ocean heat buried in deeper layers will come back to the surface, and we'll experience the warm phase of this natural cool/warm (La Niña/El Niño-based) cycle."
... "They conclude that the lull is an illusion, and that rapid warming of global surface temperatures is likely to resume in the next few years."
http://www.skepticalscience.com/NASA-scientists-expect-more-rapid-global-warming-in-the-very-near-future-part-1.html
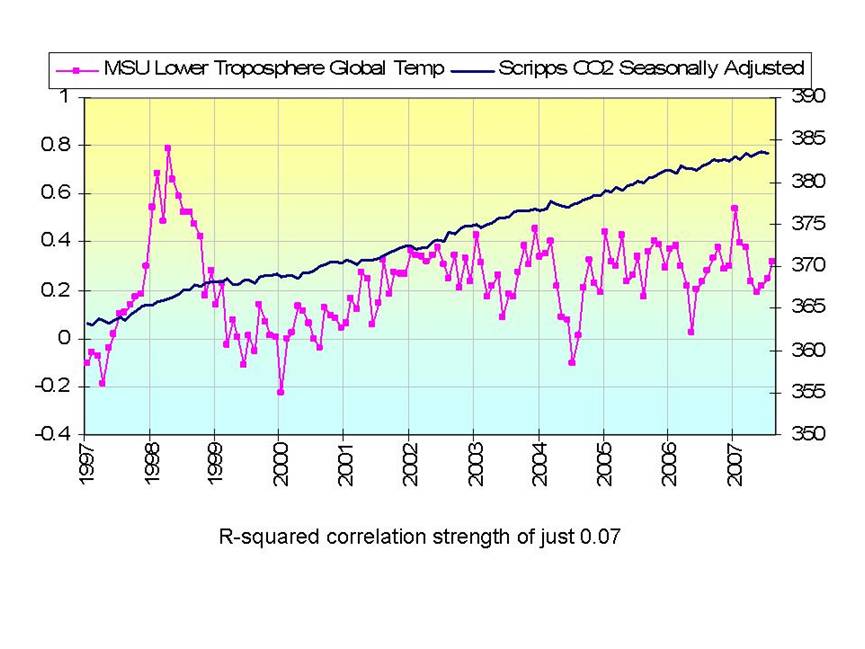
Of course, we have yet to see how much heat will be released by future El Nino events. If the 1998 year is anything to go by they could be only relatively brief events that don't much affect the overall trend - about every five years. Another unknown factor is just how long can the oceans continue to absorb heat from the atmosphere. According to this graph the oceans have been absorbing a lot of heat since about 1975, with no indication of when any of it will be released, other than during brief El Nino's. ... The extract above quotes NASA scientists saying: "rapid warming ... is likely to resume in the next few years." What evidence is there that the warming will be rapid? Also, what evidence is there that it will resume in the next few years?
This graph shows the steadily rising levels of atmospheric CO2 :-

http://hypsithermal.files.wordpress.com/2007/12/joedaleotempco2.jpg
(click on the graph for a larger image)
This graph goes back to 1880 when ground-based temperature recordings started, and shows the difference between the slight overall temperature increase and the large increase in CO2 levels :-

http://c3headlines.typepad.com/.a/6a010536b58035970c012876ffd0b9970c-pi
During the 130 years average global temperatures increased by 0.72 deg.C., and atmospheric CO2 increased by 96.7 parts per million. The arrowed lines show the overall trends. The overall trend for temperature is an increase of 0.57 deg.C. per century, and the overall trend for CO2 is an increase of 63.7 ppm per century.
(click on the graph for a larger image)
In this video (Jan 27, 2012 by The Wall Street Journal) some scientists say that there is no compelling argument for drastic action, and they say that there is no evidence of global warming for the past ten years. (The year 1998 had a particularly large El Nino effect, which can be ignored when looking for overall trends.) :-
The 'op-ed' article mentioned in the video is here :-
No Need To Panic About Global Warming
The graphs above show a very small geological time period. When you expand the time period (into tens of thousands of years) you can see that the present climate fluctuations appear to be very natural. In fact global temperatures have been much warmer than today for almost all of the past 10,000 years. The graph below was created by Cuffy and Clow in 1997, and is based on Greenland ice core records :-

http://iceagenow.info/wp-content/uploads/2011/06/Easterbrook-Natural_global_warming.jpg
NOTE: A full size graph is at the bottom of the blog page.
When you expand the time period even further into millions of years you can see that there is little correlation between CO2 levels and global temperatures :-

http://www.geocraft.com/WVFossils/PageMill_Images/image277.gif
(click on the graph for a larger image)
The text explaining the graph is on this page :-
http://www.geocraft.com/WVFossils/Carboniferous_climate.html
.


